Intro

This post builds on a post I’d written last year on , where a client asked me to implement “Citrix direct workspaces” and wanted to show the before / after You might be engaged by your client or employer to investigate a performance issue. The request could come when you’re properly caffeinated and ready to rock and roll , or, it could come when during your beauty sleep. If it’s late at night, and you got bolted out of bed by an old-school pager or phone call, you’ll have some adrenaline to grant you temporary super powers to make magic things happen that you might not normally be able to do. For this article, I’ll be focusing on various tools and procedures you can use to show before and after useful metrics for a Citrix environment
The metrics you collect can be used for the following scenarios (and more)
- Proving the outage is over, that the issue is fixed and you can go back to bed 💤🛌
- Demonstrating a positive change to the environment to improve long-term scalability and sustainability
- Identifying future bottle necks that may require changes to the environment or purchase of new infra
- Showing off to your tech friends
- Keeping Citrix honest with a claim that one of their latest features improves user experience 😉
Technical stuff
Slow logons to Citrix environment
Let’s start with an old classic, slow logons based on file server issues can impact a roaming profile setup that’s using Citrix UPM or FSLogix containers.
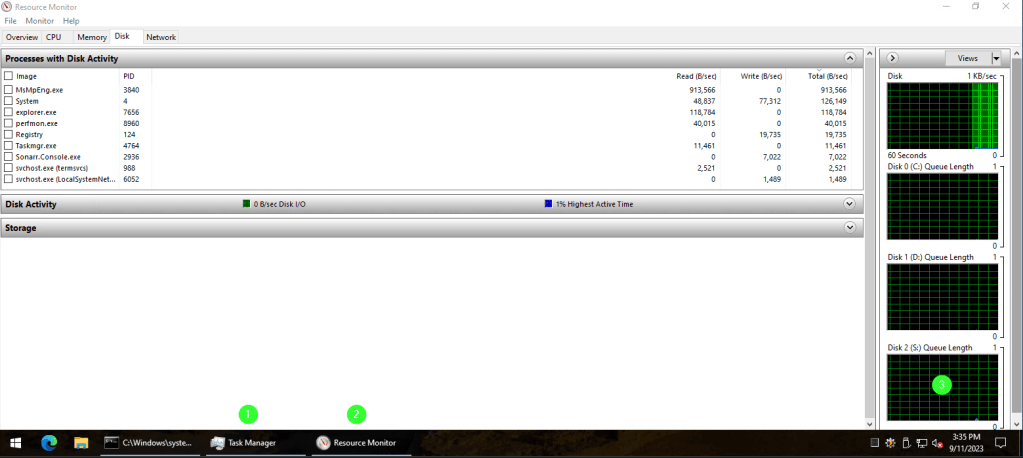
Logon to the primary file server, open task managed > then resource monito > then the DISK sub-section and check the QUEUE LENGTH
If you’re seeing a sustained queued length of 5 or more, there could be user impact, especially if you’re using Citrix UPM without containers, where you’ll have a lot more I/O on user logon or log off
I’ve mentioned in other writings and speeches that I like to use a “block” based troubleshooting method. That is, start with “big simple blocks” and get into smaller “blocks” only after the big simple stuff has been processed. For a slow filer, let’s start with a few easy checks
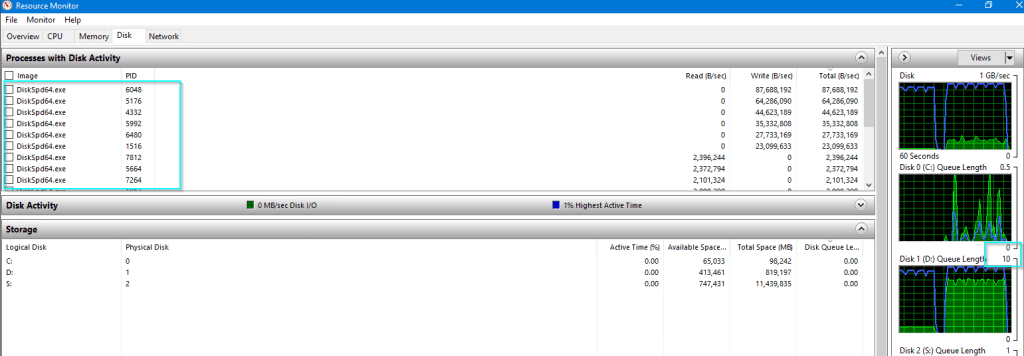
CrystalDiskMark is a good synthetic storage benchmarking tool. I generally like to run it on any new hard drive I buy for my home lab hardware, or even my laptops / primary desktop. Towards the start of a new Citrix project, I’ll also use it to ID the maximum theoretical speed the attached storage is capable of. It should be noted, running this tool on a real production system will impact over-all performance (you can see below my disk queue shot up to 10) as the various DiskSPD64.exe processes were spawned by the tool while it ran. So, if you’re running the tool proactively, do it after-hours. If you’re running it during an unplanned outage, go for it, nothing to lose now! It takes about 2-3 mins to process
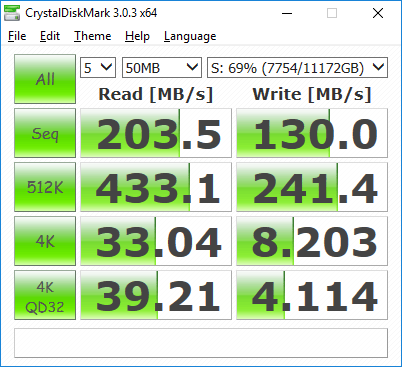
Here are completed results for my home lab filer the filer has two drives, one for OS/downloads which is running on a Samsung standard SSD , so, the 500 MB/sec read speed is expected. The 11 TB storage drive is a traditional spinner , so, the lower speed of 150 MB/sec is expected
SSD

11 TB PATA drive
vSan 3 node setup with NVM cache / SSD capacity layer setup

Certainly, too much user logon I/O can cause a degradation of service on a filer, but so too can backup tasks that are initiated by outside services, some of which can include the following:
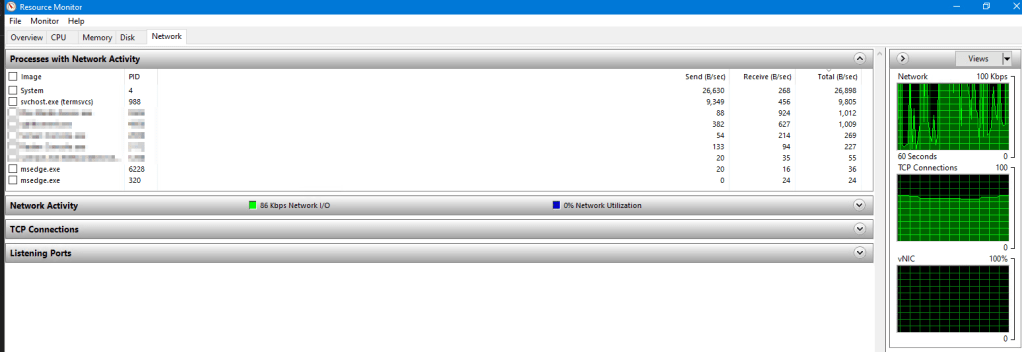
To prove that, open the NETWORK TAB
- VEEAM backup jobs
- Nutanix site replication
- vSphere automated snapshot creation / removal
- Windows scheduled tasks
If these tasks aren’t running on the filer, you’ll need to logon to your hypervisor and check for any related tasks running
Within the filer, you can use the below NETWORK TAB of resource monitor to look for system processes with a lot of send or receive activity
Once you’ve taken action, you should see the metrics drop off quickly
Another means you can use to track the impact of your filer changes, is to use the below Powershell code. It will create a 1GB test file under c:\admin, then copy it to the path
‘\FILERNAME.GOES.HERE\SHARENAMEGOESHERE’
if (-not(test-path "c:\admin")) {

    New-Item -Path c:\admin -ItemType Directory

}

fsutil file createnew c:\admin\1GB.zip 1000000000 # 1GB

Measure-Command {

    copy-item C:\admin\1GB.zip '\\FILERNAME.GOES.HERE\SUBFOLDER'

} | Select Hours, Minutes, Seconds
Logon times
Building on what I’d covered in this post on Citrix Direct workload connect from last year, Control UP provides an free script that you can use with or without the ControlUp agent. The details on implementing are here
Once you’ve put in the required GPO changes to enable auditing logon events, you’ll want to run it on a Citrix session to collect a baseline, the results should look like such:
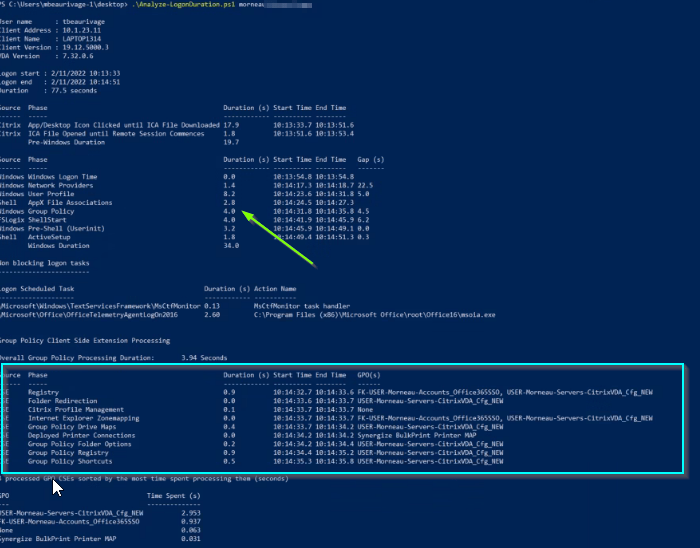
I’ve used this script dozens of times to help generate baselines for new and existing Citrix implementations. Most recently, it was used to drill down into an odd setup, where a client was mapping 100+ printers by old-school Microsoft GPP described here. That being said, don’t open that link, and don’t use GPP! GPP for mapping printers is a legacy method at this point, you’ll be better off using Citrix session printers, WEM or a third party print mgmt solution. With the case of my client, enumerating and mapping 100 + printers by GPP was adding 15-20 seconds extra to logon times
Mapping drives by GPP is another common cause of user logon slowdowns. As you would want to do for printer mappings, try to use WEM instead. If you have to map drives by GPP, the suggestion would be to use a WMI filter to ping the filer before attempting to map a drive to it. It’s not common for file servers to go down, they should not! but it does happen. You can use this simple WMI code to ensure the filer is online before mapping it. Just be aware, using WMI is legacy, and adds it’s own processing time, so, don’t ping more servers than you need to

Once you’ve taken action on your GPP/GPO settings , re-run the Analyze-LogonDuration script to confirm that your change was positive / negative / neutral
Citrix UPM filter changes
By default , Citrix UPM rules are pretty fast and loose, so will contain a lot of %temp% , %appdata% %etc% files and folders that don’t want to sync back to your filer(s)
To start, we will want to capture the current size of a recently logged on Citrix UPM folder. To drill down into the sub-folders. Install WizTree (Free!) on the filer, and capture stats for the top level directory where your UPM folders exist. 780 MB is not a good start for a new UPM profile. Could it be chromium bloat inherited with MS Edge? Surprise, surprise, it is. See below
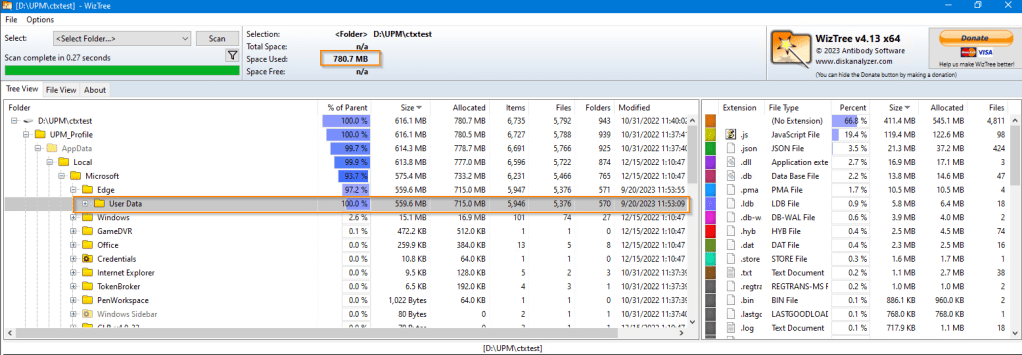
Record / save the results via screenshot.
Now, it’s time to make some edits to your existing Citrix UPM GPOs / policies to add more strictness to those files and folders we want / don’t want synchronized. See this KB from Citrix as a starting point
Complete a log off and on for your test user, then observe the results. Re-running WizTree, we now see 71 MB. which is a huge improvement.

Powershell code changes
I’ve been writing PowerShell code since 2013, I’ve only taken one formal course on the topic, but it was a big help to get instruction from an actual programmer. A lot of folks who write PS code are coming at from an admin / engineering / support perspective, so aren’t thinking about best practices to reduce code-bloat / speed of execution. PowerShell is an extremely important component of any Citrix implementation. App install scripts from my co-worker Jon Pitre or Manual Winkel, logon scripts, seal scripts, health check scripts. To keep the lights on, you’ll probably have some PS code in place. Years ago, I wrote a MONSTSER Citrix Health script that ran against 4 time zones and 100’s of XA 6.5 session hosts. I wanted the script to process as quickly as possible so that the various support teams could read the HTML report sent by email and take action on the Citrix infra as required, however, some of the regular changes I made to the script were detrimental to processing time, so I got into the habit of running the “measure-command” cmdlet within and outside of the script ensure my code changes weren’t slowing down total script processing time.
A classic example is the use of ForEach vs ForEach-Object, shown on the right. ForEach is clearly the winner This makes for a case to review your scripts, and replacing your code to use the faster method where possible

This makes for a case to review your scripts, and replacing your code to use the faster method where possible
Measuring ICA TTL / HDX session type impact
I covered this piece in more detail in this blog post from last year, here’s the summary once more
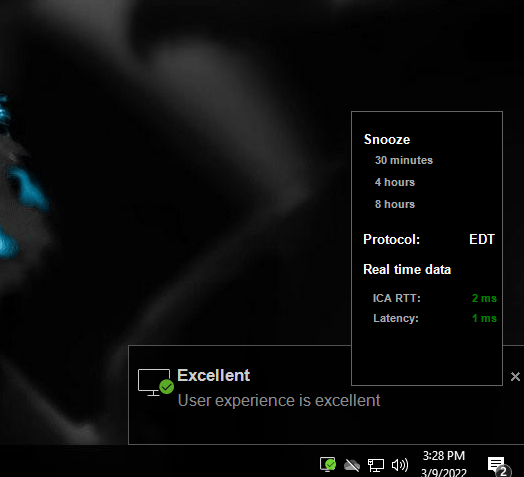
You’ll want to install Citrix Connection quality indicator on your golden image and activate the related policy on the OU where your golden image / VDAs reside. Once it’s installed, you’ll present messages to users logging about the ICA metrics. You might want to limit the usage of the policy to a test environment so as not to confuse your users
Not great!

One culprit for poor ICA session performance is EDT not working as expected, EDT has been around for about 5 or 6 years now, and is the default, which means your ICA sessions will run over UDP instead of TCP. TCP is the fallback, to confirm your ICA session is running in the correct mode, you can see the be above CQI window where the protocol is shown, else, you can also open a regular CMD window and type in:
CTXSESSION -v
This will list all ICA sessions on the VDA, if CGP
UDP > CGP > ICA indicates a successful connection over EDT

Here’s a screenshot of CQI after setting up Citrix direct workload connect, much better!
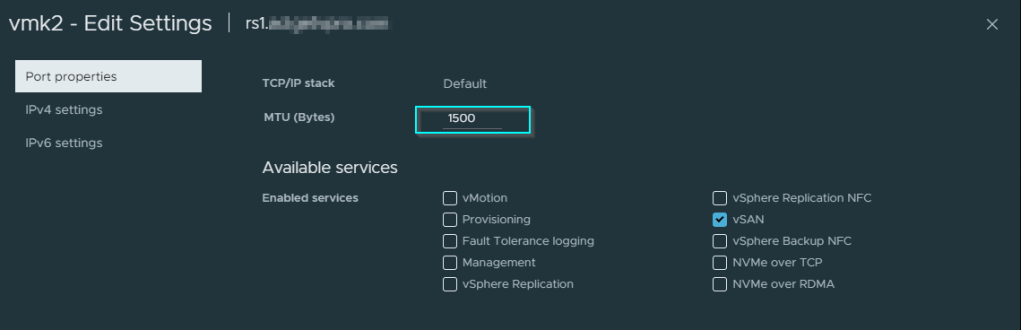
VMKPing for MTU
This entry is a bit different than the other sections, and stands alone as the section that I took the time to learn and implement on my 10 Gbe enabled home lab, but have never actually extended to a real production environment. Amending the default MTU of 1500 (1514) in a lot of production environments can be very challenging. For me, my MTU journey in Citrix environments began / end with this set of glorious blog posts from fellow Canadian Trentent Tye
Lets Make PVS Target Device Booting Great Again (Part 1) (trentent.github.io)
Lets Make PVS Target Device Booting Great Again (Part 1) (trentent.github.io)
Trentent got some very impressive boot time reductions by amending MTU at each level in the stack
YMMV, regardless, you need a means to measure the changes to MTU on your VMs, VMware VMKernel adapters and other layer 3 (IP) enabled devices along the way
Let’s get to it! The reference article from VMware for the use of VMKping is here
My current lab is setup on the default MTU of 1492, using vmkping from one of my ESXi 8 hosts to another is shown below in the 4 tests, I start with 1400, incrementing by 40 points until the tests fail at 1480

As these tests are being done on my lab, they involve two ESXi hosts, with Intel DA2 10Gbe adapters that support jumbo frames, the process to increase the MTU window would involve amending the following window on your related VMKernel adapter , as well, you’ll need to dial up the MTU window on your related layer 3 enabled switches, to save time, you can bump up your MTU window by 50 or 100 points at a time, until your “message too long” reply errors no longer appear
CPU ready time
I’ve had a fast / standardized means to evaluate VMware environments for a few years now, but last year I added a function from another Powershell code-creator to collect CPU ready time stats at a per hour/day/week/month/yearly level. The latest script is here
“CPU ready time” describes the time when a VM is ready to send a request to the host CPU, but the request gets queued for later execution. Your magic number here is the same for both two big dog on-prem HVs, it’s 5%. Similar to a one or more students raising their hands to answer a question in class, but the teacher already has a back fill of previous requests that need to be answered. One of the common culprits for this situation, is where too many vCPUs are assigned to a VM. By default, a VM with more vCPUs assigned receives more priority than one with less. IT staff will often assign more vCPUs to VMs to resolve performance issues, without having reviewed historical data to justify having the extra vCPUs. Below is a good example that shows where too many vCPU are assigned to one of my lab VMs called WIN10-MGMT2V . I’ve got 6 vCPUs, but the ready states don’t justify it, nothing above 5% ready state. In this case, if you don’t have CPU hot add active, power off the VM and reduce the vCPU count

Hopefully, you will find this blog post during 9-5 hours, and not at 3 am when you’re client has engaged you when things have gone south
have a great day, everyone 😎😎
Owen Reynolds
