The TASK
New automation efforts are often born from the need to automate repetitive tasks. I was a dedicated virtualization consultant from 2017 to early 2024. During that time, I’d often get engaged to help out customers who were running into performance and scalability issues with their vSphere environments, sometimes it started with the dreaded “Citrix is slow”, other times, the customer wasn’t running any VDI solution at all, and wanted my assistance for an environmental audit. The common pieces of information to gather were always the same, so, I knew I needed to automate the process to ensure consistency and efficiency
The solution
PowerCLI is the Powershell-based framework that VMware provides us for interfacing with vCenter/ESXi remote instances. I’ve been using it for years now, and for the most part, anything you can grab via the full vSphere web-client you can collect via PowerCLI. In fact, I’d say the section that collects CPU READY time is actually a bit easier to read via my PowerCLI script than via vSphere web-client

The repo is located here: https://github.com/getvpro/Get-VMware-QuickInventory
Download the script to a location on a computer with a recent version of PowerShell installed
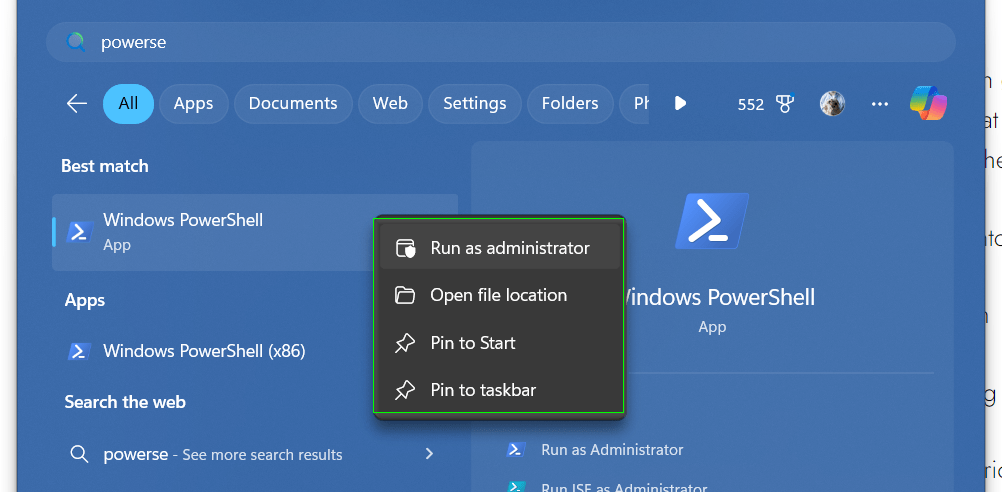
To get started, open up an elevated PowerShell ISE / regular PS admin session
The package provider NUGET will be installed to facilitate installing the VMware PowerCLI module from PS Windows gallery ; be patient, I’ve seen it take up to 10 mins to get PowerCLI installed on some systems
Once the pre-req binaries are installed, you will be prompted to enter in a vCenter address (enter it without the leading https://)
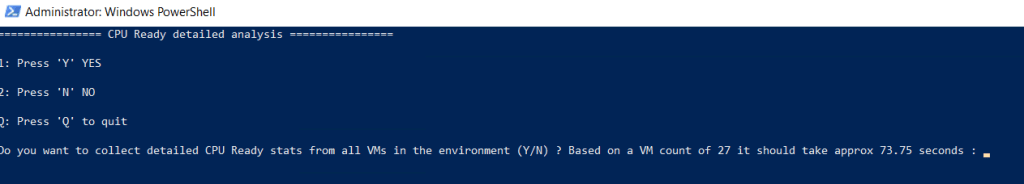
You will then receive a second [y]/[n] prompt for collection of additional historical performance data for VMs on each ESXi host
The script will output to a time-stamped HTML report that will open towards the end of the script via the default web browser on the system it’s run from
The 8 key checks that are reported on are as follows:
- Check that the NTP service is set to ca.ntp.org or pool.ntp.org and to set to “start/stop with host”
- Check that the power management settings for the ESXi host is set to HIGH PERFORMANCE , else the max performance the ESXi server CPU will run at, will be 80%
- Scans all VMs to ID which ones are still using Intel E1000 NIC types, which are less performant than the VMware VMNet 3 type NICs. The suggestion would be to change the NIC from E1000 to VMnet 3. Note: This will require re-adding static IP info, if a MAC address was used for firewall rules or DHCP reservation, that will need to be reset as well
- Scan all VMs to ID which ones are using LSI logic SCSI adapters, which are less performant than the VMware Paravirtual SCSI controller types (see this independent blog post. Where possible change the type to VMware paravirtual, you will first need to add the VMware paravirtual controller on the related shell, have the OS detect it, then power off the VM shell and amend the SCSI settings to point to the new VMware paravirtual controller
- Scan all VMs to ID which are are running older versions of VMware tools. The suggestion would be to update the ESXi host VMware tools repo with the latest version, then set VMs to upgrade to the latest version on reboot. Ensure this is tested first and done in a maintenance window
- Scan all VMs to ID which are on older VM hardware types on their shell. The suggestion would be to schedule upgrades/reboots of the shells in a maintenance window
- Scan all VMs to ID which ESXi hosts are running older BIOS (EFI) levels. The suggestion would be to update where required in a maintenance window
- Checks vCPU to Physical CPU ratio. It’s suggested not to exceed a ratio of 5 for Citrix environments , but other workloads can run fine at higher ratios
- Collects CPU ready time to determine if you’ve over or under-provisioned vCPU count for your various VMs. Remember, a high CPU ready time means the VM wants to queue a thread to the physical CPU on the associated host, but can’t, it’s like raising your hand in a meeting or class, and not being answered right away.
The above 9 checks can then be used to deliver to your customer, you can expand on each point to add part of a wider vSphere environmental report, which I did many times over the years. Having a starting point of automation for a report is a great way to start.
I hope you find the script useful comments via the blog or Github are welcome
have a nice day 😎
Owen
